Social Media Analytics for Agencies Built to Scale Your Business
CampaignSwift's social media analytics for agencies gives every client their own analytics page: Facebook, Instagram, LinkedIn and YouTube results in one view, compared with the previous period, plus an Outcomes page that sets Google Analytics and agreed goals beside them. Below is what you can measure on each network, what clients receive, and where our analytics stops. The client-facing side is our social media reporting tool for agencies.
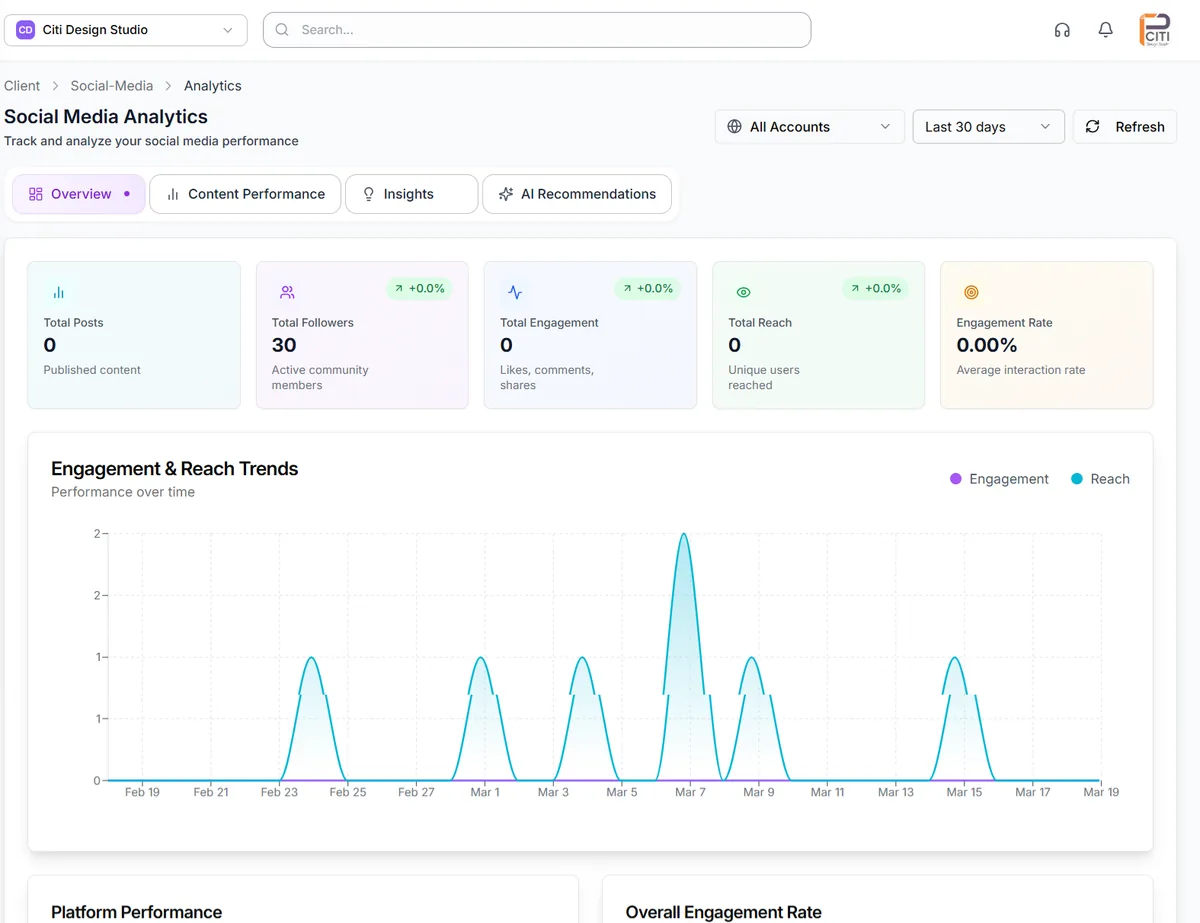
One client's Overview tab: the headline numbers with their change against the previous period, the account and date pickers, and the engagement and reach trend.
Why social media analytics for agencies gets messy
The data is rarely the hard part. Collecting it per client, and turning it into a decision, is.
A login per network, per client
01Twelve clients on four networks is 48 dashboards, each with its own date picker and its own idea of what engagement means. Plenty of agency Mondays start right there, copying numbers into a sheet.
Numbers nobody can act on
02A client does not care that reach went up unless someone says why and what happens next. A raw export leaves that work to whoever builds the report, usually at the end of the month.
No line from likes to the business
03The goals agreed at kickoff, usually leads, sales or site visits, rarely sit next to the social numbers. So the monthly call drifts back to likes and followers.
Finding out at renewal
04A client's results slide for six weeks and nobody notices until they ask for a meeting about "the direction of the account". By then the numbers are an argument, not a plan.
Each client's results, in one place
Four tabs per client, plus an Outcomes page that connects social to the client's business.
One analytics page per client
Each client has their own Analytics page. It opens on all of that client's connected accounts together, and you can narrow it to one network or any mix of accounts. Date ranges run from the last 7 days to the last year.
Change against the previous period
The Overview shows total posts, followers, engagement, reach and engagement rate. Followers, engagement and reach are compared with the previous period of the same length, and a trend chart plots engagement and reach across the range.
The posts that worked
Top Performing Posts ranks the client's posts by engagement, with a link to each one. Content Type Performance compares images, videos and carousels on a single network, and the Content Performance tab sorts the top posts by engagement or reach.
Best times to post
The Insights tab works out a client's best posting times from their own posts once there are at least 30 in the range. It also compares engagement rate, reach per post and posting frequency with the previous period.
AI help with content
Paste a draft caption into AI Predict Performance for an engagement estimate before it goes out, and open the AI Recommendations tab for a suggested content mix and weekly schedule built from the client's own posts. More on our AI social media analytics page.
Outcomes and goals
Each client's Outcomes page sets social reach, engagement rate and followers next to Google Analytics revenue, transactions and goal completions, and tracks progress against the goals you agreed. The Reporting & Retention agent scores churn risk every week.
What our cross-platform analytics measures, network by network
Most tools are thorough on Instagram and thin everywhere else, so here is exactly what CampaignSwift shows for each network, and how much history arrives when you connect an account.
| Network | What you see | History on connect |
|---|---|---|
| Facebook Page | Followers and reach. For each post: engagement, reach, reactions, comments and shares. | Up to 90 days and 50 posts |
| Instagram professional account | Followers, reach and engagement. For each post: likes, comments, shares and reach. | Up to 90 days and 50 posts |
| LinkedIn company page | Followers, reach and engagement (likes, comments and shares). For each post: engagement. | The latest 50 posts from the last 90 days; followers from the day you connect |
| YouTube channel | Subscribers, views, likes and comments. For each video: views, likes, comments and engagement rate. | 30 days of channel data and the latest 25 videos |
| TikTok | Follower count. | From the first daily sync after you connect |
| X | Not collected. Posts still publish to X. | Not collected |
| Not in the Analytics screen. Pins still publish from CampaignSwift. | Not collected |
Each network counts engagement its own way. YouTube counts likes and comments, LinkedIn adds shares, and Instagram reports its own interactions total. The Platform Performance card puts a client's networks side by side, so read it for direction and trend rather than as a straight contest between them.
Social data syncs once a day. Google Analytics updates every 6 hours and Search Console daily, a few days behind. Personal LinkedIn profiles don't share analytics, so only company pages have numbers. If most of your clients live on Meta, our comparison of Instagram vs Facebook analytics explains what each one reports.
The metrics that belong in a client review
Good social media analytics for agencies follows the client's funnel, from people who saw the work to what they did next. Likes on their own rarely keep a retainer; a line from reach to site visits to sales usually does.
Each metric sits somewhere specific in CampaignSwift, and one doesn't sit anywhere. Our social media analytics metrics guide defines each one and shows how engagement rate is worked out, in case a client asks.
From analytics to the client report
Analytics is where your team works; the report is what the client reads. Reports use the same data, add a written Insights summary and the top 10 posts, and go out weekly or monthly as a PDF with a link to view it online. Every report carries your agency name, and on Scale your logo, colour and footer too: see white label social media reports for what clients see. Clients don't get a login; the agency client portal page lists everything they can open.
Running analytics for many clients
Every client is its own workspace in CampaignSwift, with its own connected accounts, analytics, goals and reports, and you move between them from the client switcher. That keeps one client's numbers out of another client's report, which is the first job of social media analytics for agencies once you pass ten accounts. Our multi-client social media management page covers the setup.
There is no screen that ranks all your clients by performance. Across the agency you get an operational view instead: the dashboard counts active clients, tasks, campaigns, scheduled posts and connected accounts that need attention. Each week the churn-risk score flags clients who are slipping, with an in-app alert and an email when the risk is high. If Facebook, Instagram or LinkedIn rejects a client's connection, the team gets a reconnect alert.
Setting up agency social media analytics in four steps
Most of the work is agreeing goals with the client. The goals and KPI contract guide explains how the Onboarding agent drafts one.
Connect each client
Connect Facebook, Instagram, LinkedIn, YouTube, TikTok and X through each network's own sign-in. Facebook and Instagram bring up to 90 days of history.
Agree the goals
In one click, the Onboarding agent drafts a goals and KPI contract for a new client. You edit it, agree it with the client, and progress tracks against it.
Review every week
Open each client's Overview and Insights tabs, read the change against last period, and note the posts worth repeating.
Report to the client
Schedule a weekly or monthly report, or run one on demand, with a written Insights summary.
How agencies use client analytics
Three common setups, written as examples rather than customer case studies.
Retainer agency, twelve clients
Monday morning meant logging into each network for each client and pasting numbers into a sheet before anyone could say what had changed.
The team opens each client's Overview, reads the change against last period, and spends the time on the few clients whose numbers moved. The weekly churn-risk score points to who needs a call first.
Clients who want results
Every monthly call came back to "what did social do for sales?", and the deck only had likes and followers.
With Google Analytics connected, the Outcomes page shows revenue, transactions and goal completions next to the social numbers, plus progress against the targets agreed at kickoff.
Small team planning content
Posting times and formats came from habit, or from whatever had worked for the last client.
Once a client has 30 posts in the range, Insights suggests their best posting times, and Content Type Performance shows whether carousels or videos earn more engagement on each network.
Choosing social media analytics tools for agencies
Most tools can draw a follower chart. For an agency, the differences show up in five questions. Our roundup of the best social media analytics tools for agencies puts the main options side by side.
Does it keep clients separate?
Agency analytics starts with structure. Each client needs their own accounts, numbers and reports, so a forwarded report never shows another client's data. Ask how a tool groups accounts before you look at a single chart.
How deep does it go on each network?
Check the network table for every tool you trial, ours included. CampaignSwift covers Facebook, Instagram, LinkedIn company pages and YouTube, tracks followers only on TikTok, and has no analytics for X or Pinterest. If a client lives on one of those, test that network first.
Can it connect social to the client's business?
Followers start the conversation; leads and revenue keep the account. Look for Google Analytics, agreed goals and a way to show progress against them. Our guide to Google Analytics for social media covers the setup, and how to track social media analytics covers the weekly habit.
What will clients actually receive?
Some tools give clients a login to a live dashboard, others send a report. We send reports and a no-login report page. To see what a strong one says, browse our social media analytics examples.
Where our analytics stops
Data refreshes daily, not in real time. There are no competitor or industry benchmarks, no custom dashboards or metric picker, no audience demographics, no ranking of clients against each other, and no export other than PDF reports. There are no analytics for X or Pinterest, and TikTok shows the follower count only. It covers organic social, not ad spend or paid campaign results.
For mentions and their sentiment on a client's connected accounts, see social media sentiment analysis; there is no keyword listening across the wider web. Every plan includes analytics, and the pricing page lists the client limits.
Agency analytics questions
What agencies ask before they move client measurement into one tool.
Ready to put the busywork on agents?
Start with one client. Connect accounts, send your first approval link, and let the agents take the follow-ups. Plans start at $29/mo.
30-day free trial · No credit card · Cancel anytime
Questions? Book a 15-min demo call
Schedule Demo