Best Social Media Analytics Tools 2026 Guide
Looking for the best social media analytics tools? We tested and compared the top platforms for agencies and marketing teams, covering audience insights, competitor analysis, cross-channel reporting, AI-powered recommendations, and pricing. If you're a solo marketer or an agency managing multiple clients across Instagram, TikTok, LinkedIn, and Meta, here's how to pick the right analytics platform.

Why Your Analytics Tool Choice Matters
The impact of choosing the right (or wrong) tool
Time Lost to Wrong Tools
01The wrong analytics tool costs hours every week: fighting clunky interfaces, manually compiling data, and working around limitations. The right tool pays for itself in time saved and insights gained.
Scaling Costs Can Explode
02What starts as affordable can become expensive fast. Per-seat pricing, overage charges, and enterprise upsells catch many teams off-guard. Understanding total cost of ownership matters more than monthly price.
Migration Pain Is Real
03Switching analytics tools means losing historical data, retraining teams, and rebuilding reports. Getting it right the first time (or at least understanding what you're signing up for) saves significant pain later.
Features vs. Actual Needs
04Enterprise tools with hundreds of features often overwhelm small teams. Basic tools frustrate growing teams. Matching tool capabilities to your actual needs, not hypothetical future needs, is the key to satisfaction.
Best Social Media Analytics Tools by Category
Our recommendations for different needs and budgets
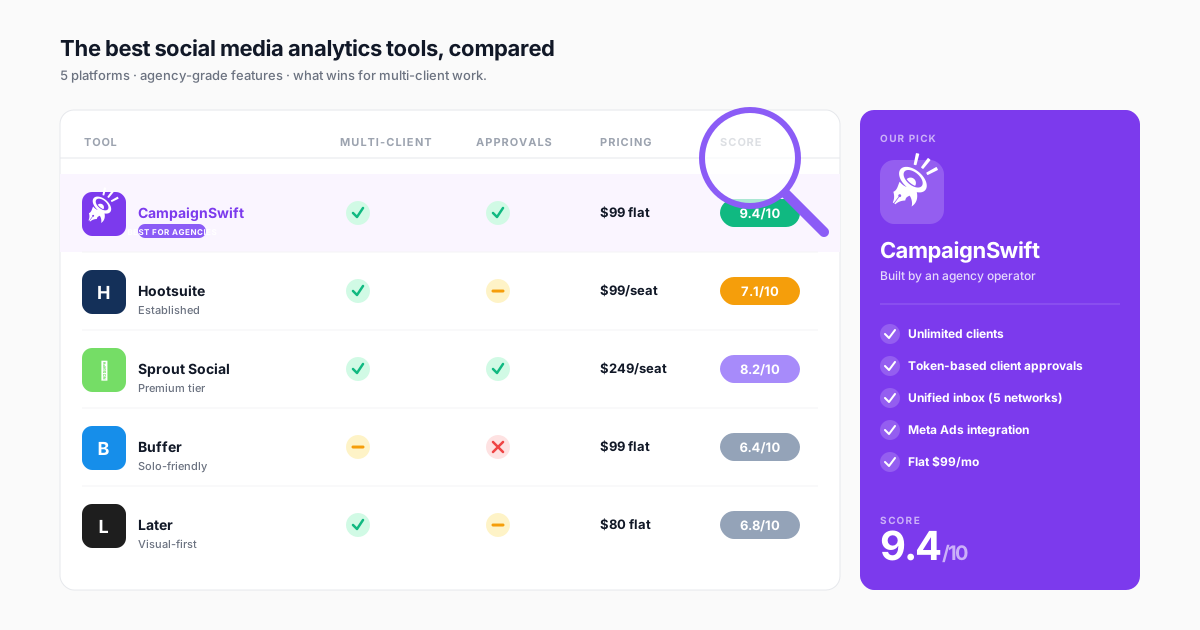
Best Overall: CampaignSwift
Purpose-built for agencies and teams managing multiple accounts. Unified analytics across all platforms, AI-powered insights, white-label reporting, and client portals. Flat per-plan pricing with no per-user fees makes it ideal for scaling teams.
- No per-user fees
- White-label reports
- AI insights
- Multi-client management
Best for Enterprises: Sprinklr
Comprehensive enterprise platform with cross-platform analytics, competitor tracking, and governance controls. Best for large organizations running hundreds of social accounts with multi-region governance and dedicated social teams.
- Enterprise security
- Global support
- Advanced governance
- Custom integrations
Best for SMBs: Sprout Social
A solid balance of features and usability: post-level engagement analytics, calendar-based scheduling, and a manageable learning curve. Per-seat pricing adds up as the team grows, but the value holds for growing marketing teams.
- Intuitive interface
- Good analytics depth
- Team collaboration
- Reliable support
Best Budget Option: Buffer
Single-account focus with fast onboarding and almost no learning curve. The analytics are lighter than competitors, but the publishing-plus-essentials combo works well for solo marketers and small businesses managing one account or a 3-5 channel presence.
- Affordable pricing
- Easy to use
- Basic analytics
- Clean interface
Best for Social Listening: Brandwatch
If monitoring brand mentions, sentiment, and conversations is your priority, Brandwatch excels. Keyword and competitor-mention tracking across millions of online sources, plus trend detection, for PR and brand management teams.
- Real-time listening
- Sentiment analysis
- Competitive intel
- Crisis detection
Best for Competitor Analysis: Socialinsider
If understanding how your social media performance stacks up against competitors is your priority, Socialinsider excels. Cross-platform benchmarking, competitor analytics, content performance insights, and industry benchmarks help brands and agencies make smarter, data-backed decisions.
- Competitor benchmarking
- Cross-platform analytics
- Content insights
- Industry benchmarks
How We Evaluated These Tools
Our testing and comparison methodology
Real-World Testing
We connected actual social accounts and tested each tool in real conditions, not demo environments with perfect sample data. This reveals true performance, interface quirks, and data accuracy issues that demos hide.
Feature-by-Feature Comparison
We evaluated core capabilities: data coverage (platforms supported), analytics depth, reporting customization, automation features, collaboration tools, integrations, and export capabilities.
Pricing Analysis
We calculated total cost of ownership at different team sizes, not just base pricing. This includes per-seat costs, overage charges, required add-ons, and the pricing trajectory as you scale.
User Experience Assessment
Learning curve, daily workflow efficiency, documentation quality, and support responsiveness all factor into long-term satisfaction. The best features don't matter if the tool is painful to use.
Which Tool Is Right For You?
Illustrative scenarios matching tools to common situations
Solo Marketer or Freelancer
Limited budget, 1-5 accounts, need simple reportingOverwhelmed by enterprise tools. Free trials expire before learning the interface. Paying for features never used.
Started with Buffer for basic analytics and scheduling. Clean interface, affordable pricing, quick setup. Will upgrade when needs grow.
Marketing Team (5-20 people)
Multiple team members, client reporting, need collaborationOutgrew basic tools. Team fighting over spreadsheets. Inconsistent reporting. No approval workflows.
Implemented Sprout Social for team collaboration, approval workflows, and consistent reporting. Per-seat pricing is manageable at current size.
Digital Marketing Agency
50+ client accounts, white-label needs, scale challengesPer-seat pricing exploded with team growth. No white-label options. Clients couldn't access their own data. Tool costs eating margins.
Switched to CampaignSwift's Scale plan with unlimited users and white-label reports. One predictable price regardless of team size. Client portals for self-serve access.
Quick Comparison Table
| Tool | Best For | Starting Price | Key Strength |
|---|---|---|---|
| CampaignSwift | Agencies | $29/mo (flat per-plan) | Multi-client + AI insights |
| Sprout Social | SMB teams | $249/mo per seat | Balance features/usability |
| Hootsuite | Publishing focus | $99/mo | Scheduling + basic analytics |
| Buffer | Solo/small biz | $6/mo per channel | Simple and affordable |
| Socialinsider | Competitor analysis | $83/month | Cross-platform analysis, competitor analysis, AI-enabled insights |
| Brandwatch | Social listening | Custom pricing | Monitoring + sentiment |
| Sprinklr | Enterprise | Custom pricing | Governance + scale |
Our Testing Methodology
We connected real social accounts, tested each tool against real agency workflows, evaluated the features that matter day to day, and calculated true total costs. These aren't sponsored placements. They're recommendations based on actual testing and user research.
What to Look For in Any Tool
- Platform coverage: Does it support all the networks you use?
- Data depth: Are the metrics comprehensive enough for your analysis needs?
- Reporting flexibility: Can you customize reports or are you stuck with templates?
- Scalability: What happens to pricing as you grow?
- Export options: Can you get your data out if you need to switch?
Try CampaignSwift Free
See why agencies choose CampaignSwift for multi-client social media analytics. As a full social media analytics software platform, it gives you white-label reports, client portals, and AI-powered insights, with flat per-plan pricing, no per-user fees, and unlimited seats on the Scale plan.
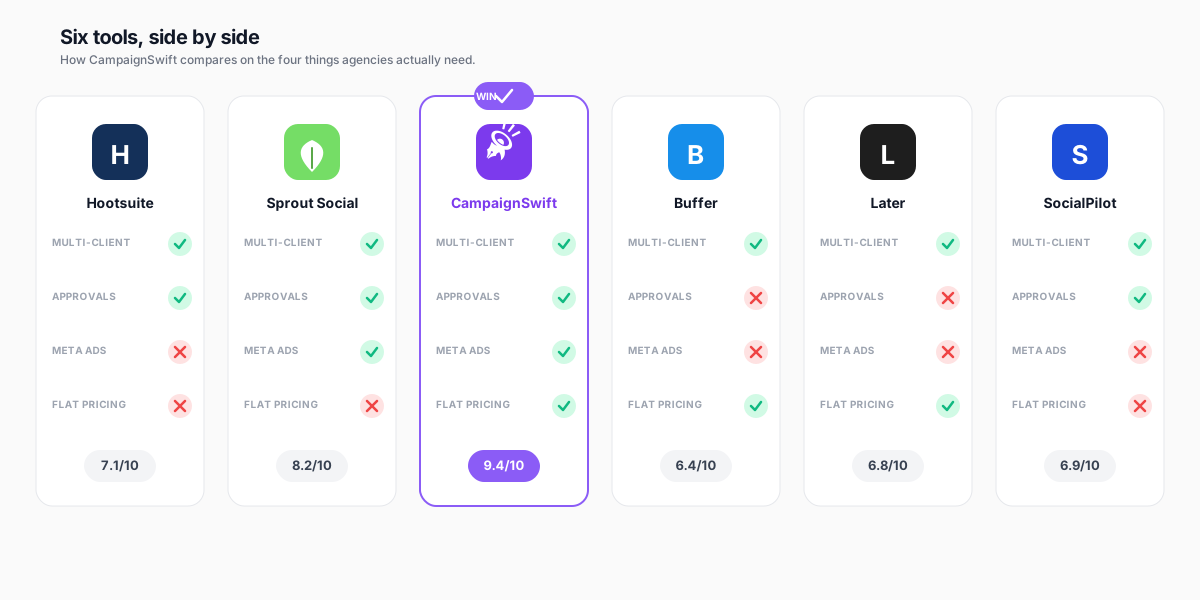
Side-by-Side Feature Comparison
| Tool | Multi-client | Approvals | Meta Ads | Flat Pricing | Rating |
|---|---|---|---|---|---|
| CampaignSwift | ✅ | ✅ | ✅ | ✅ | 9.2/10 |
| Sprout Social | ✅ | ✅ | ❌ | ❌ | 8.5/10 |
| Hootsuite | ✅ | ❌ | ❌ | ❌ | 7.5/10 |
| Buffer | ❌ | ❌ | ❌ | ❌ | 7.5/10 |
| Socialinsider | ✅ | ❌ | ❌ | ✅ | 8.3/10 |
| Brandwatch | ✅ | ❌ | ❌ | ❌ | 8.0/10 |
| Sprinklr | ✅ | ✅ | ❌ | ❌ | 8.7/10 |
How to Actually Evaluate Social Media Analytics Tools (Without the Marketing Speak)
Step past the feature lists
Every analytics tool's website looks impressive. They all claim "advanced AI," "real-time insights," "enterprise-grade security," and "one-click integrations." After reviewing dozens of tools over the years, we have learned that feature checklists tell you almost nothing about how a tool actually performs day-to-day. The difference between a tool you love using and one you abandon within three months is rarely visible on the marketing page.
The agencies that pick the right tool the first time follow a different evaluation process. They focus on five specific factors that predict real-world success, and they weight those factors based on their actual team size and growth stage, not what looks impressive in a demo. (New to the topic? Start with our complete guide to social media analytics for the fundamentals, then come back to compare tools.)
The five evaluation criteria that actually matter:
- 1. Time-to-first-insight: How long from signup to seeing your first useful data point? If onboarding takes longer than an afternoon for a single account, multiply that for client work and decide whether you can afford it.
- 2. Workflow fit: Does the tool match how your team already works, or does it force you to change your process to fit the tool? Workflow mismatches are the #1 reason agencies abandon tools.
- 3. Pricing trajectory: Not just today's price, but what it will cost at 2x your current team size. Per-seat tools that look affordable at 3 users become budget conversations at 10.
- 4. Cross-account capability: If you manage multiple clients or brands, can you compare them in one view? Single-brand tools force constant switching that destroys analytical thinking.
- 5. Export and ownership: Can you get your data out cleanly? Tools that lock data in proprietary formats create switching costs that benefit them, not you.
Weight the criteria differently based on team size
A solo creator and a 40-person agency are evaluating the same tools but should prioritize completely different criteria. The solo creator cares most about time-to-first-insight and pricing, since they have no client reporting requirements and limited budget. The 40-person agency cares most about cross-account capability and pricing trajectory, because workflow fit at scale is more valuable than any single feature.
We have seen agencies make the mistake of buying enterprise-grade tools when they had a 5-person team because the features looked impressive. They paid 4x what they needed and used 20% of the capability. We have also seen the opposite: agencies sticking with simple tools well past the point where workflow friction was costing them billable hours every week. The right approach is to pick the tool that fits your current team plus one growth stage ahead, not three.
Our broader breakdown of analytics platforms for agencies walks through this evaluation in more depth, with specific scoring frameworks for each criterion.
The demo questions that reveal what marketing pages hide
When you book a demo, the sales team will walk you through their best features in their best light. The questions below are the ones that surface the limitations they will not volunteer:
- "Show me your tool using my actual data, not your demo account." If they cannot, that tells you something about onboarding time and data-import reliability.
- "What happens if I exceed my plan's social account limit mid-month?" Overage pricing varies wildly: some tools charge a small fee, others 5-10x your monthly cost.
- "How long does it take to add a new team member, and what does it cost?" Per-seat tools that look affordable can become prohibitively expensive as you scale hiring.
- "Can I see historical data older than my subscription start date?" Some tools pull historical data on signup, others only track from day one. This matters enormously for trend analysis.
- "What is your support response time SLA on my plan tier?" "24/7 support" often means a chatbot on lower tiers. Real human support is usually reserved for enterprise.
The Hidden Costs Analytics Tool Marketing Pages Never Mention
The per-seat pricing trap
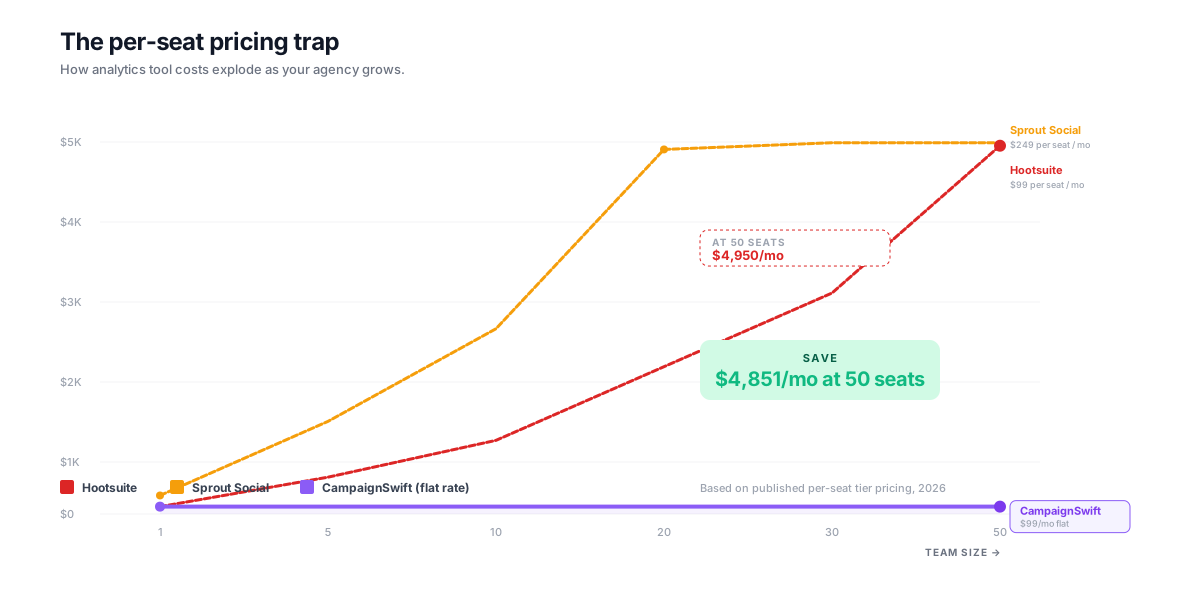
The single biggest pricing surprise we see agencies hit is per-seat scaling. A tool that costs $99/month for one user looks great on paper. The same tool at $99/month per user costs $1,485/month for a 15-person team. By the time the team realizes the math, they have already trained everyone, integrated the tool into their workflows, and built reports they cannot easily reproduce elsewhere. Migration becomes expensive enough that they keep paying.
The agencies that avoid this trap calculate fully-loaded costs at 2x their current team size before signing any annual contract. If a tool starts becoming unaffordable when you double, do not pick that tool. You will outgrow it within 18 months. We cover the broader stack-cost calculation in how agencies cut tool stack costs by consolidating, which applies the same logic across an entire tool stack.
Hidden cost categories most teams forget to budget for:
- Overage charges: Posts beyond plan limit, social accounts beyond cap, API calls past quota
- Add-on modules: "Analytics is included," but advanced analytics costs extra. Read the fine print.
- Integration fees: Zapier-style automation often counted against task limits or charged separately
- Onboarding/training: Enterprise tools charge $5K-$25K for "implementation," sometimes mandatory
- Annual commitment penalties: Cancellation mid-year may forfeit remaining months even if month-to-month is advertised
- Data export fees: Some tools charge to export your historical data when leaving
The time cost of fighting your tool
The cost no agency tracks but every agency pays: the hours your team loses fighting a tool that does not fit their workflow. We have seen agencies where a community manager spends 45 minutes every morning just navigating between platform views, exporting CSVs, and reconciling data, all of which adds zero value but consumes billable hours. Multiply that across a 10-person team and you are looking at well over 30 hours weekly of pure friction.
When you calculate the true cost of an analytics tool, include this friction. A tool that costs $1,000/month but saves your team 30 hours weekly versus a tool that costs $300/month but costs your team 30 hours weekly: the math is not close. The expensive tool is dramatically cheaper. Most agencies do not run this calculation because the friction is distributed across people who do not flag it as a separate cost.
Migration costs when you outgrow your choice
Picking the wrong tool the first time has compounding costs that show up months later. You lose historical data when switching (some tools do not let you export it cleanly). Your team has to relearn workflows. Custom reports built in tool A do not transfer to tool B. Integrations break and need to be rebuilt. Client-facing portals lose their branding while you migrate.
A realistic estimate puts migration costs at 80-150 hours of team time plus 1-3 months of degraded reporting quality. Picking the right tool the first time, even if it costs more, is usually cheaper than picking cheap and migrating later.
Why Multi-Client Agencies Need Fundamentally Different Analytics
The questions an agency analyst actually needs answered
Single-brand analytics tools and multi-client agency analytics tools answer different questions, even though they often share similar interfaces. Most analytics tools were built for the single-brand use case: one company analyzing its own performance over time. They answer questions like "How did engagement change this month?" and "Which post performed best?" That framing breaks down completely when you are responsible for 12 client accounts simultaneously.
An agency analyst needs to answer fundamentally different questions every Monday morning. "Which 3 of my 12 clients are trending down right now?" "What content type works across my e-commerce clients vs my SaaS clients?" "Are my retainer clients hitting their KPIs faster than my project clients?" These are portfolio-level questions, not single-account questions. Trying to answer them by switching between 12 separate client dashboards is not a workflow. It is an obstacle to actually doing strategic work.
The portfolio-level questions only agency-grade tools can answer:
- Which clients are gaining ground vs falling behind their industry benchmarks?
- What patterns hold across all clients in a vertical (e.g., all 8 fitness brands)?
- Where should we allocate creative resources to maximize ROI across the entire client portfolio?
- Which client accounts are at retention risk based on declining engagement?
- What is the cross-client benchmark we can use to set realistic targets with new clients?
White-label is not a nice-to-have for agencies
The other thing single-brand tools get wrong for agencies is the client-facing experience. When a client opens a report that says "Powered by [Tool Name]" in the footer, your agency just provided a free advertisement for your tool vendor and undermined your premium positioning. The agencies that scale fastest treat their reports and client portals as part of their brand experience: fully white-labeled, on a custom domain, with their logo and color scheme throughout.
Most general-purpose analytics tools either do not offer white-labeling or reserve it for their highest enterprise tier. Agency-purpose-built tools like CampaignSwift's analytics for agencies include white-labeling as a standard feature because they understand it is non-negotiable for client-facing work.
Per-client structure matters more than per-feature depth
Most agencies that scale past 15 clients have abandoned single-brand analytics tools entirely, not because the features were inadequate, but because the structural model could not handle multiple clients cleanly. Per-client workspaces, per-client permissions, per-client templates, and per-client reporting are not "features" you can patch onto a single-brand tool. They are architectural decisions a tool either made early or did not.
We unpack the broader pattern in our analysis of how agencies actually structure multi-client management. The summary is that tooling structure determines team structure, and agencies that try to force single-brand tools into multi-client workflows end up with team structures that do not scale.
The Metrics the Best Social Media Analytics Tools Should Track
A tool comparison is only useful if you know what you are comparing the tools on. The best social media analytics tools differ less on whether they report a number and more on how honestly and deeply they report it. Before you commit to any platform, make sure it covers the metrics that actually drive decisions, not just the vanity numbers that look good in a screenshot. If you are still mapping out your measurement framework, our guide on how to track social media analytics walks through which numbers matter at each stage.
Reach and impressions: the difference matters
Reach is how many unique people saw your content; impressions is the total number of times it was displayed, including repeat views. Weak tools blur the two or report only one. Strong tools separate them clearly, because the gap between reach and impressions tells you whether a post spread to new audiences or just resurfaced to the same followers. For agencies, that distinction is the difference between proving audience growth and accidentally reporting the same eyeballs twice.
Engagement rate, not raw engagement
Raw likes and comments are easy to inflate and hard to compare across accounts of different sizes. Engagement rate (interactions divided by reach or followers) is the metric that lets you benchmark a 5,000-follower client against a 500,000-follower one fairly. The best analytics tools calculate engagement rate consistently and let you set the denominator, so your reporting stays honest as accounts scale. Pair that with follower growth over time and you can show whether engagement is rising because the content improved or simply because the audience got bigger.
Click-through, conversions, and share of voice
Once you move past awareness, the metrics that matter shift toward action: click-through rate (CTR) on links, conversions attributed back to social, and share of voice against competitors. CTR tells you whether your content actually motivates the next step; competitor share of voice (best tracked through dedicated social media monitoring analytics) tells you whether your client is winning or losing the conversation in their category. Tools that handle hashtag performance and audience demographics on top of these give you the context to explain why a number moved, not just that it did. Good data visualization then turns all of it into something a client understands in ten seconds rather than ten minutes, which is the whole point of the monthly reports agencies send clients.
The metric checklist before you buy:
- Reach vs. impressions reported separately, not merged into one vague "views" number
- Engagement rate with a configurable denominator, so cross-account benchmarking stays fair
- Follower growth trends: net growth, not just gross new follows
- CTR and conversion attribution: the bridge from social activity to business results
- Competitor share of voice: context for whether you are winning the category
If a tool cannot give you these cleanly, no amount of dashboard polish makes up for it. The metrics are the product; the interface is just how you read them. If you want to start measuring before you commit to a paid platform, our roundup of free social media analytics tools and the wider free tools and templates library cover the basics, and for teams that need to work with raw exports, dedicated social media data analytics handles the heavier lifting.
What is Changing in 2026: AI, Privacy, and the Future of Social Media Analytics
AI is changing what "analytics" means
Two years ago, "AI-powered analytics" was mostly marketing language for slightly better recommendation engines. In 2026, it has become substantive. The newer generation of tools can generate written summaries of monthly performance, identify outlier posts and explain why they outperformed, predict which content types will work for a specific audience based on historical patterns, and surface action items rather than just data. The tools that have not invested in AI integration are starting to feel slow by comparison.
The catch: AI insights are only as good as the data feeding them. Tools with weak multi-platform coverage produce weak AI insights because they are missing context. The agencies getting the most value from AI features are using tools that combine deep platform integration with quality AI summarization, not bolt-on AI built on shallow data.
Privacy changes are eroding old metrics
Cookie deprecation, iOS privacy updates, and platform API restrictions continue to chip away at the data analytics tools can collect. Attribution windows have shrunk. Some audience demographics are no longer available. Conversion tracking from social to website is increasingly opaque. The tools that have adapted to this new reality emphasize first-party signals, engaged audience metrics, and longer-form attribution models. The tools that have not are quietly degrading in usefulness.
If you are evaluating tools in 2026, ask how they handle the privacy transition. The answer to "How do you measure attribution post-cookie?" reveals whether the vendor is investing in the future or coasting on yesterday's playbook.
Real-time and predictive analytics are diverging from reporting tools
Two distinct analytics categories are emerging. Traditional reporting tools (backward-looking, optimized for monthly client reports) remain valuable but are increasingly commoditized. Real-time analytics and predictive analytics are emerging as a separate category: forward-looking, optimized for content optimization decisions made in the moment.
The agencies winning in 2026 are using both. Real-time analytics to catch issues fast and capitalize on trending content. Reporting analytics to demonstrate value to clients monthly. Tools that try to do both serve neither use case as well as specialized tools, but the convergence is happening, and the tools that integrate both modes cleanly will likely dominate the next 2-3 years.
How to choose your tool in 2026
Picking the right social media analytics tool comes down to three honest questions: What questions do you actually need answered weekly? How will your needs change in 12-18 months? What is your budget at that future state, not today? If your answers point toward agency-scale work with multiple clients, our multi-client analytics approach is purpose-built for that use case. If you are still single-brand, simpler tools work fine; just pick the one whose pricing trajectory matches where you are headed.
For deeper dives on specific topics, our roundup of real analytics report examples shows what the output of good analytics work actually looks like, and our analysis of Instagram vs Facebook analytics covers a common comparison agencies face when allocating attention across platforms.
What the Best Social Media Analytics Tools Actually Measure
Before comparing pricing tiers, it helps to understand what a real analytics platform is measuring under the hood. The best social media analytics tools all surface the same core data categories, just at different depths and with different interpretation layers on top.
Audience insights and follower growth
Audience insights are the foundation of any analytics tool. Who follows you, where they live, what they engage with, and how that audience has shifted month over month. The native dashboards (Instagram Insights, Meta Business Suite, LinkedIn Analytics, TikTok Analytics, and YouTube Studio) all surface follower growth, audience demographics, and active hours. Third-party platforms aggregate these into cross-channel views so a marketing agency managing 15 brands isn't logging into 60+ native dashboards each week.
Engagement rate and content performance
Engagement rate (likes, comments, shares, and saves divided by reach or follower count) is the single most-watched KPI across analytics platforms. Top-tier tools go deeper: average engagement rate per content format (Reels vs. carousels vs. static posts), engagement rate by posting time, and benchmarks against industry peers. Strong content performance reporting also covers click-through rate, video completion rate, and the engagement-to-conversion path that ties social activity to business outcomes.
Competitor analysis and benchmarks
Competitor analysis is where third-party platforms separate from native dashboards. Tracking competitor follower growth, posting cadence, engagement rate, and content themes gives agencies a real benchmark for client conversations beyond "we grew X% this month." Tools like Socialinsider, Brandwatch, Sprout Social, and Sprinklr offer deep competitor tracking; lighter tools surface enough for monthly client decks without enterprise pricing. A useful benchmark answers the question "is this client outperforming, matching, or trailing their category?", which is the conversation clients actually pay agencies to have. If you're weighing a dedicated monitoring tool against a unified agency platform, our Brandwatch alternative and Meltwater alternative breakdowns cover where each fits an agency budget.
Conversion tracking and attribution
Engagement metrics tell you what happened on the platform. Conversion tracking tells you what happened in the business. The best social media analytics tools connect platform data to downstream actions (site visits, signups, purchases, lead form completions) through UTM parameter tracking, pixel data from Meta and TikTok, and integrations with Google Analytics 4. Attribution is messier in 2026 than it was pre-iOS-14 changes, but the analytics tools that survive are the ones that present an honest attribution model rather than vague "AI-attributed conversions" with no methodology disclosed.
Social listening and sentiment
Social listening and sentiment analysis are the highest-value features for agencies running brand-led work. Listening tools surface mentions of the client's brand, products, or category across social platforms, news sites, forums, and review platforms. Sentiment analysis layers natural-language processing on top to categorize each mention as positive, negative, or neutral. AI-powered sentiment is now table-stakes on enterprise-tier tools and increasingly available in mid-tier platforms. For agencies handling crisis response or competitive intelligence, this is often the feature that justifies the spend.
Cross-channel and real-time reporting
Cross-channel reporting is the single biggest gap between native dashboards and third-party analytics platforms. Native tools show you one platform at a time; the best analytics tools roll Instagram, Facebook, TikTok, LinkedIn, YouTube, and X performance into a single client dashboard. Agencies that hit this single-platform ceiling on a scheduler's built-in stats often compare a Buffer analytics alternative or a Later analytics alternative for true cross-channel rollup. Real-time reporting matters most during launches and campaign-critical windows, when waiting for tomorrow's data costs you the chance to course-correct today. The combination of cross-channel rollup plus real-time data is what separates a $9/month analytics dashboard from a $200+/month agency-grade analytics platform.
When you evaluate the best social media analytics tools against your own use case, work backward from the KPI conversations you have with clients. If those conversations focus on engagement rate and follower growth, mid-tier tools cover it. If they routinely include attribution, competitor benchmarks, sentiment shifts, and cross-platform ROI, you need agency-grade analytics with all six categories under one roof. The price difference between tiers is large, but the right tier matches the depth of the question clients are paying you to answer. For a structured side-by-side comparison of the five platforms most agencies evaluate at this decision point, see our analytics tools breakdown.
The Feature Most "Best Tools" Lists Ignore: Approval Workflows
Almost every analytics tool roundup compares the same things: platform coverage, chart depth, export formats, pricing. But for agencies, the feature that actually decides whether a tool survives past month three is rarely on the comparison table: does it handle the approval process between pulling an insight and acting on it? The best analytics in the world are useless if a recommended post sits in an email thread for five days waiting for a client to sign off.
The 10-15 client tipping point
For a typical agency managing 10-15+ clients, building a structured approval workflow into the analytics and publishing stack (instead of bolting it on through email, Slack, and spreadsheets) means approval turnaround measured in hours instead of days, and a meaningful share of each week reclaimed from sign-off chasing.
Why approval workflows belong in the analytics conversation
As an agency scales, the ad-hoc approval process (a client comment here, a Slack thread there, a doc with twelve revision marks) becomes the single biggest bottleneck between insight and action. A built-in approval workflow turns that chaos into a multi-stage approval chain: an analyst flags a recommendation, an internal review validates it, and the client gets a one-click sign-off, all with a clean audit trail of who approved what and when. That audit trail and version history matter as much as any dashboard metric when a client later asks why a campaign ran the way it did.
Before and after: a 15-client agency
Picture a marketing agency running 60+ posts a week across 15 clients: five-plus hours a day chasing approvals through scattered channels, with no visibility into which posts are stuck in approval limbo. Average time from analyst recommendation to client sign-off: five days, and posts sometimes publish without final review under deadline pressure. Move content review and client approval into one platform with no-login review screens, and internal and client sign-off run in parallel rather than in sequence. In a setup like this, approval time can drop from five days to under 48 hours, with unapproved posts blocked at the approval gate instead of slipping through. For the visual side of that process, creative approval software handles the design feedback loop the same way.
- Visual previews: Clients see the exact post in context before approving, with no Word docs bouncing around and no ambiguity about the final format.
- No-login client review: External stakeholders review and approve without creating an account, which removes the friction that stalls most approvals.
- Automatic version locking: Once content is approved, it locks, so no surprise edits slip through after sign-off.
- Direct publishing bridge: Approval flows straight into scheduling, eliminating the manual copy-paste and sync errors that cause unapproved content to go live.
If you want the full stage-by-stage breakdown of how to structure this, our guide to agency approval workflows walks through the internal-review-to-client-sign-off chain in detail. The short version: when you evaluate the best social media analytics tools for agency work, weight approval workflow support as heavily as the metrics themselves, because that is the feature that determines whether your insights ever turn into published, on-brand content.
Best Social Media Analytics Tools: FAQs
Common questions about choosing tools
It depends on your specific needs. For agencies: CampaignSwift (flat per-plan pricing, white-label). For enterprises: Sprinklr (governance, scale). For SMBs: Sprout Social (balance of features/usability). For budget-conscious: Buffer (simple, affordable). For social listening: Brandwatch (monitoring focus). There's no universal 'best', only best for your situation.
Yes, for the right use case. Native platform analytics provide valuable data at no cost. The limitation is fragmentation across platforms. Free tools are excellent for starting out, learning what you need, and supplementing paid tools. As you scale, time costs often justify paying for unified tools.
Budget by team size: Solo/small business ($0-50/month), Growing teams ($100-300/month), Agencies ($200-500/month), Enterprise ($1,000-5,000+/month). Consider total cost including all seats, integrations, and overages, not just advertised pricing.
Must-haves for most teams: multi-platform support, engagement metrics, automated reporting, data export. Nice-to-haves depending on needs: competitor tracking, sentiment analysis, AI insights, white-label options, API access. Don't pay for features you won't use.
Build a business case: quantify current pain (hours wasted, missing data, scaling costs), document the gap, calculate ROI of switching (time saved, better decisions), propose a pilot. Most resist change until cost of status quo exceeds cost of migration.
Yes. Many teams use complementary tools. Example: native platform analytics for real-time checks, unified tool for cross-platform reporting, listening tool for brand monitoring. The key is avoiding redundancy and ensuring data consistency across tools.
Critical questions: Can I see my actual data (not samples)? What happens at plan limits? How does pricing scale? What's the export process? Historical data access? Onboarding timeline? Support included vs. paid? Trial before annual commitment?
Basic setup: 1-2 hours to connect accounts. Full configuration: 1-2 weeks for custom reports, team training, workflow integration. Enterprise implementations: 1-3 months with dedicated onboarding. Factor setup time into your decision. Complex tools have longer time-to-value.
Still have questions?
Our team is here to help. Book a 15-minute call to get all your questions answered.
Ready to put the busywork on agents?
Start with one client. Connect accounts, send your first approval link, and let the agents take the follow-ups. Plans start at $29/mo.
30-day free trial · No credit card · Cancel anytime
Questions? Book a 15-min demo call
Schedule Demo